Nabídka nemovitostí
Reality
Přehled nemovitostí, které odpovídají vybraným kritériím. V detailu zakázky naleznete kontakty na makléře, tj. telefon, email či kontaktní formulář. Neváhejte nás kontaktovat s prodejem či pronájmem každé nemovitosti Vám vždy ochotně pomůžeme.
Pozemek, bydlení, pozemek: 950 m2
Aktivní
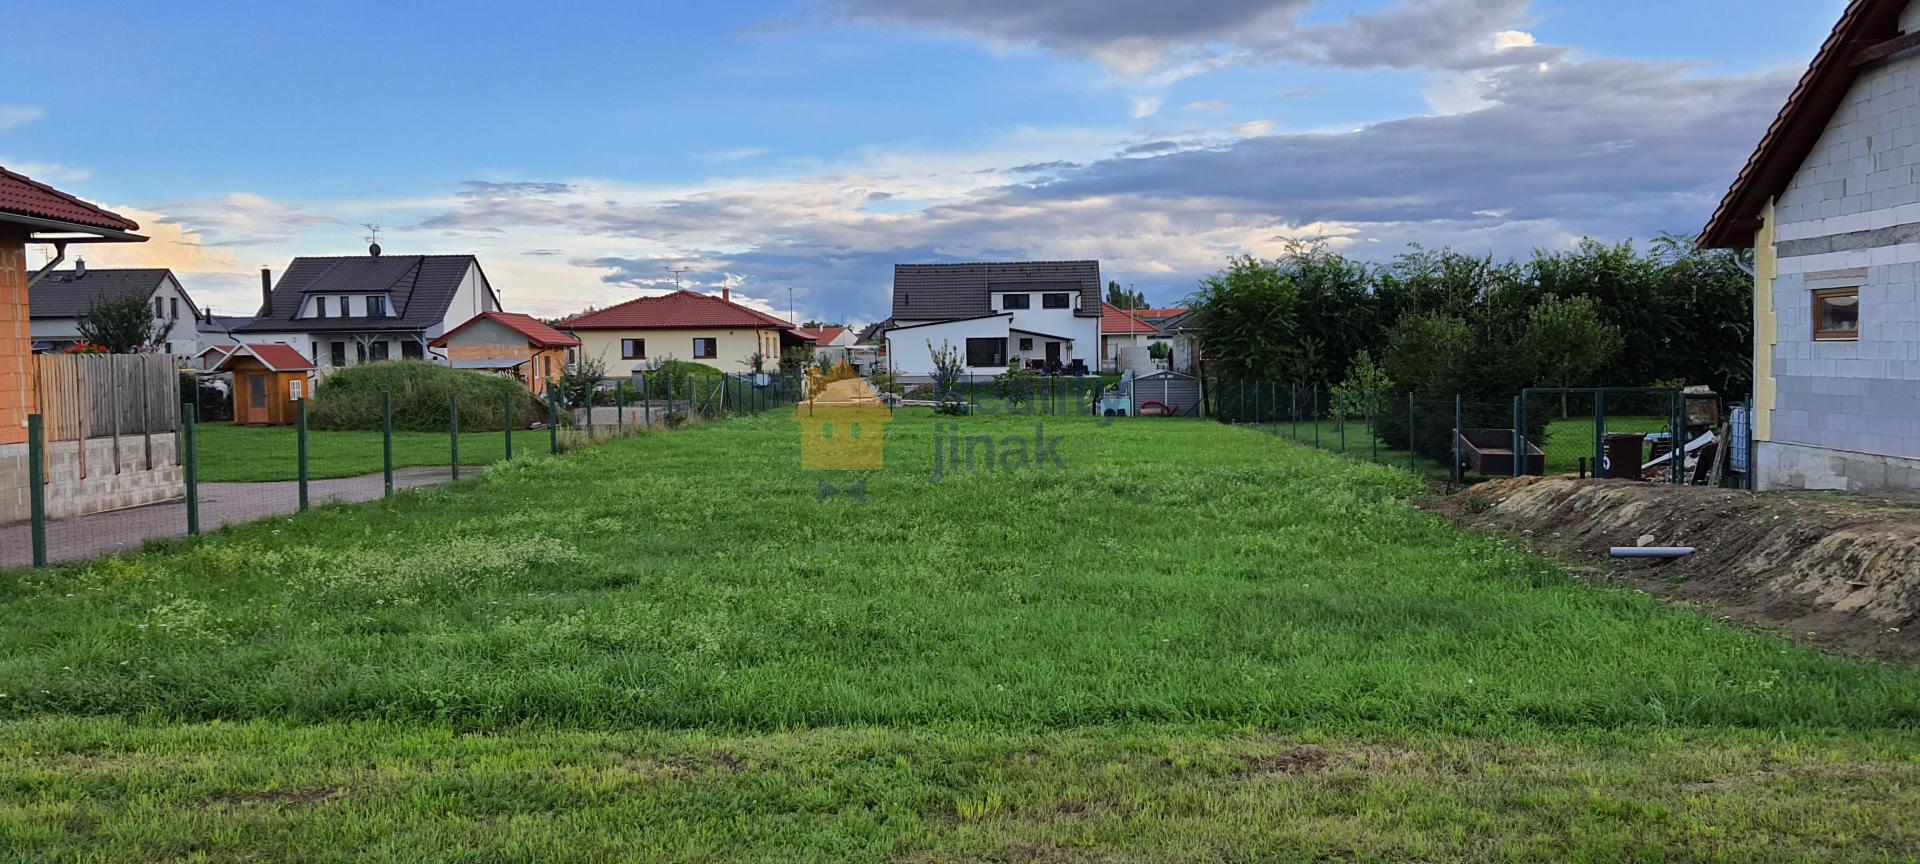
Prodej pozemku se stavebním povolením na hezkém a klidném místě, 950 m2, Novosedly na Moravě
3 990 000Kč

Obchodní prostor, lokalita: Rušná část obce, obchod: 52 m2
Aktivní
Prodej obchodního prostoru v centru Brna, 52 m2, ul. Nádražní, Staré Brno
Info v RK

Chata, konstrukce: Smíšená, obytná: 51 m2, zastavěná: 41 m2, pozemek: 379 m2, stav: Samostatně stojící, stav: Dobrý, lokalita: Polosamota, Sklep, Parkování, Bazén, místnosti: 7
Aktivní
Chata 80 m2, Chyňava, pozemek 379 m2, okr. Beroun
2 500 000Kč

Pozemek, bydlení, pozemek: 1928 m2
Aktivní
Prodej stavebního pozemku, pro bydlení, 1928 m2 v Kanicích u Brna
6 998 640Kč

Pension, lokalita: Klidná část obce, pozemek: 1346 m2
Aktivní
Prodej ubytovny 1094 m2, restaurace, kavárna, Bystřice nad Pernštejnem
Info v RK

Ostatní komerční objekt, lokalita: Klidná část obce, pozemek: 1729 m2
Aktivní
Prodej komerčního objektu v Hustopečích u Brna, 920 m2, pozemek 1729 m2, ul. U Větrolamu
17 990 000Kč

Činžovní dům, konstrukce: Cihlová, obytná: 730 m2, zastavěná: 733 m2, pozemek: 1346 m2, stav: Samostatně stojící, stav: Velmi dobrý, lokalita: Klidná část obce, Bezbariérový přístup, Sklep
Aktivní
Prodej ubytovny 1094 m2, restaurace, kavárna, Bystřice nad Pernštejnem
Info v RK

Rodinný dům, konstrukce: Cihlová, zastavěná: 486 m2, pozemek: 1192 m2, stav: Dvojdům, stav: Před rekonstrukcí, lokalita: Klidná část obce, Sklep, Garáž, Parkování, místnosti: 8
Aktivní
Prodej rodinného domu 128 m2, pozemek 1192 m2, Chlum u Letovic
3 990 000Kč

2+1, Osobní, konstrukce: Cihlová, 78 m2, 1. podlaží, Lodžie, Sklep, stav: Před rekonstrukcí, lokalita: Klidná část obce
Aktivní
Prodej bytu 2+1, OV, 84 m2, lodžie, sklep, ul. Verdunská, Praha 6, Bubeneč
10 700 000Kč

Zahrada, pozemek: 686 m2
Aktivní
Prodej rekreačního pozemku u vodní nádrže, Pasohlávky, 686 m2
979 000Kč

Pozemek, bydlení, pozemek: 536 m2
Aktivní
Prodej stavebního pozemku v Rozdrojovicích, 536 m2, Brno
5 490 000Kč

Rodinný dům, konstrukce: Cihlová, zastavěná: 57 m2, pozemek: 1082 m2, stav: Samostatně stojící, stav: Po rekonstrukci, lokalita: Klidná část obce, Sklep, Parkování, Bazén, místnosti: 4
Aktivní
Prodej rodinného domu 3+kk s možností rozšíření, pozemek 1082 m2, Sentice
6 750 000Kč